On the analytics section you can find all details about views, activity and interactions with your project
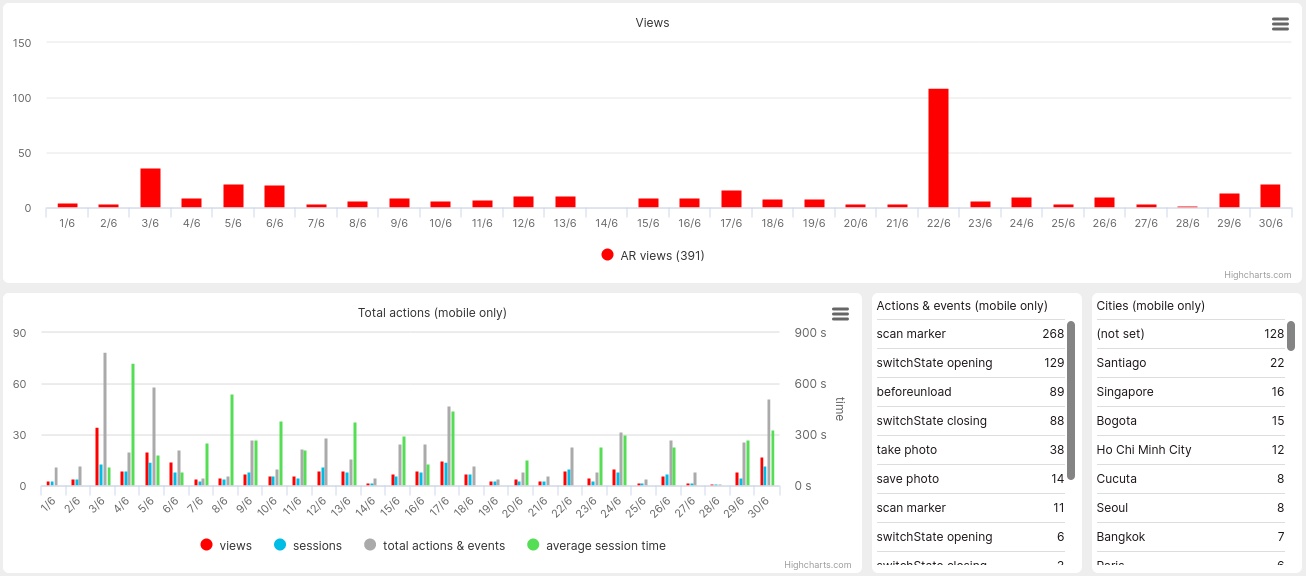
The First Row is displaying the amount of views by date.
The Total Actions section tells you about specific data for your experience: time, sessions and the average sessions time.
Action & events column is for interactions with events and possible interactions in your experience like taking a photo, switching to a state, scan an image tracking marker.
The cities sections is for where your experiences were viewed geographically, and the number of views filtered by cities.
All this data can be filtered by year, by month, or a date interval.